
On Thursday morning, The Walt Disney Company (DIS) released the firm’s fiscal fourth quarter financial results.
Thank you for reading this post, don't forget to subscribe!For the period ended September 27, Disney posted an adjusted EPS of $1.11 (GAAP EPS: $0.73) on revenue of $22.464 billion. While the adjusted bottom-line number did beat Wall Street, the GAAP bottom-line number fell significantly short of expectations. Additionally, that top-line print also missed the mark while contracted 0.5% on a year-over-year basis.
Segment Performance
- Entertainment: generated revenue of $10.208 billion (-6%), which produced operating income of $691 million (-35%). Linear Networks revenue was down 16%, as operating income was down 21%. Direct-to-Consumer revenue was up 8%, as operating income was up 39%. Content Licensing revenue was down 26%, as operating income went negative (-$52 million).
- Sports: generated revenue of $3.98 billion (+2%), which produced operating income of $911 million (-2%). ESPN revenue was up 3%, as operating income was down small. Star India is no longer part of the mix.
- Experiences: generated revenue of $8.766 billion (+6%), which produced operating income of $1.878 billion (+13%). Domestic Parks revenue was up 6%, as operating income was up 9%. International Parks revenue was up 10%, as operating income was up 25%. Consumer Products revenue was up 3%, as operating income was up 14%.
Guidance
For fiscal full year 2026, Disney is projecting double digit (in percentage terms) year-over-year adjusted EPS growth. Wall Street was looking for growth of roughly 10.4%. The firm is also projecting full year operating cash flow of about $19 billion, which is far better than the $16.9 billion that Wall Street had in mind.
Fundamentals
For the quarter reported, Disney generated operating cash flow of $4.74 billion (-18.9%). Out of that number came capex spending of $1.916 billion. This left free cash flow of $2.558 billion (-36.5%). For the full year, Disney repurchased $3.5 billion worth of common stock for the corporate treasury while dishing out cash dividends of $1.803 billion to shareholders.
Moving on to the balance sheet, Disney ended the period with a cash position of $5.695 billion and inventories of $2.134 billion. That leaves current assets at $24.267 billion. Current liabilities add up to $34.162 billion. This includes $6.711 billion in shorter-term debt, but also $6.248 billion in deferred revenue. At the headline, the firm’s current and quick ratios stand at 0.71 and 0.65, which is rather awful. Even adjusted for those deferred revenues, these ratios only rise to 0.87 and 0.79. That’s still not acceptable.
Total assets amount to $197.514 billion. Of this, goodwill and other intangibles add up to $82.565 billion. At 42% of total assets, this is sloppy. That said, if anyone has a right to claim intangibles as major assets, it is probably Disney. Total liabilities less equity comes to $82.902 billion, including $35,315 billion in longer-term debt.
This is not a strong balance sheet. This is not even remotely close to being a strong balance sheet. That said, the firm did reduce its debt-load by a rough $3.7 billion over 12 months, so it does appear that the CFO Hugh Johnston who took the job in late 2023 is fully cognizant that this is an issue and he is trying to do something about it.
Maybe not repurchasing $3.5 billion in common stock over the year and putting that dough towards the balance sheet might have been a more prudent approach, but who the heck am I?
My Thoughts
Disney has issues. No doubt about that. Revenue has stagnated. Cash flows are still strong, but in a state of deterioration. The balance sheet, to put it as politely as possible, stinks. Johnston inherited that mess, but he may have to get more aggressive in addressing it.
Concerning the firm’s businesses, the parks (and cruises) are doing well, consumer products are doing well, direct-to-consumer (Disney+ and Hulu) are really taking off, and ESPN is holding its own. Beyond that, linear networks (cable TV) is deteriorating rapidly and content licensing is no longer even profitable. This is a really tough stock to own.
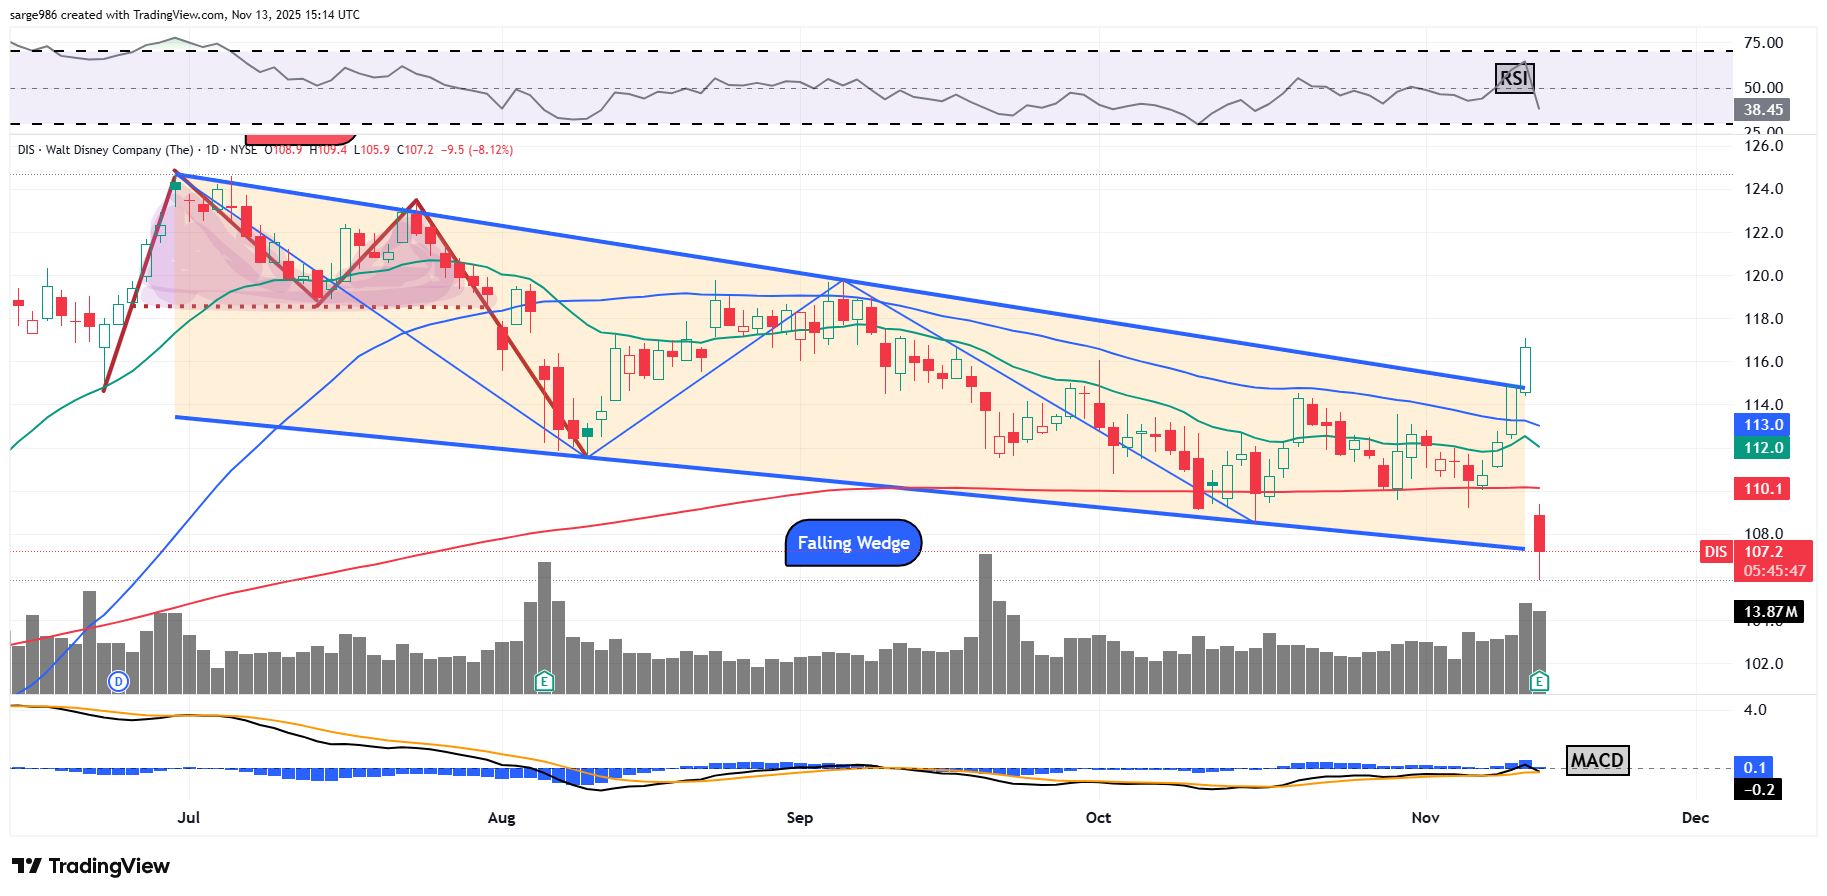
Take a look at this. DIS came off of a double-top pattern of bearish reversal in July and proceeded to develop a falling wedge of bullish reversal as the shares sold off over a five-month period. It almost worked. On Wednesday, ahead of earnings DIS tested the upper trendline of that wedge. Thursday morning? The stock has surrendered its 50-day SMA (losing some portfolio managers), its 21-day EMA (losing the swing crowd) and its 200-day SMA (losing seriously die-hard portfolio managers).
The stock is now testing the lower trendline of the wedge. I’ll tell you what, cowboy: this stock breaks a pattern of bullish reversal to the downside on the same day that risk managers are forcing portfolio managers to reduce long-side exposure and my guess is that the pain will not end here. The stock bottomed at $80.10 back in early April.
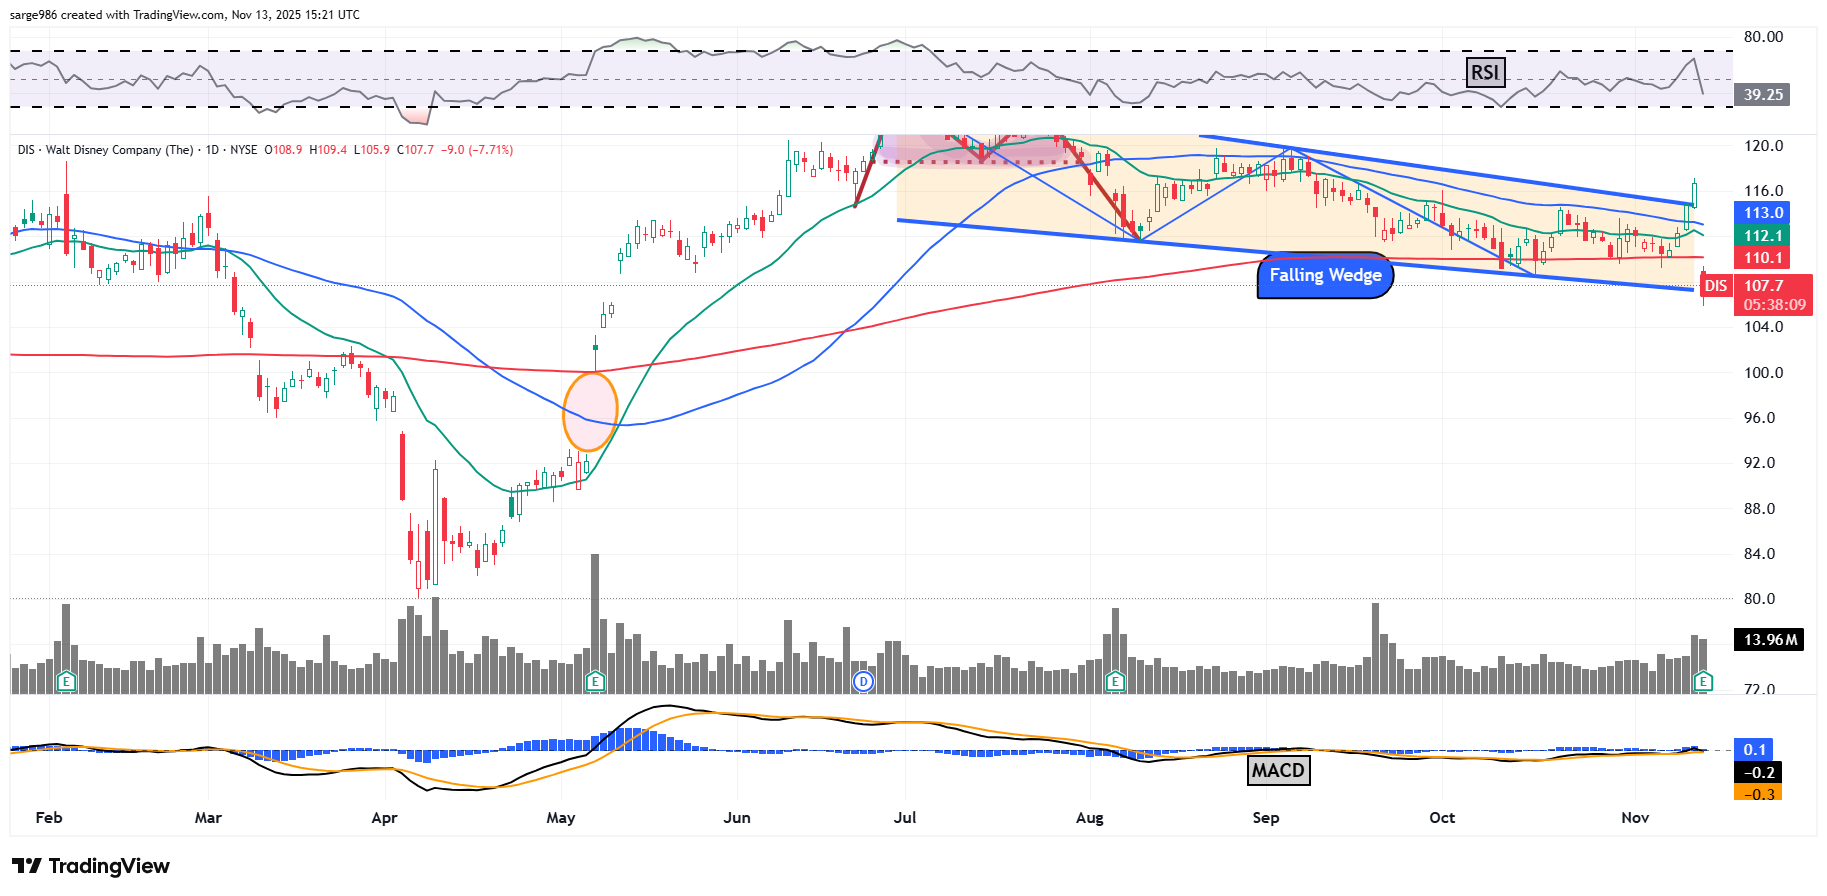
I don’t think so. However, do you see that unfilled gap that had been created back in May? That’s very possible. You know the old adage: “Unfilled gaps don’t have to fill, but they usually do.”